Comparing stock market charts with frequent sets of keywords in Twitter microblogs messages.
Download Tweet Miner (twm.zip)
I would like to present an R code for the analysis of tweets from a specified list of twitter users,
such as: CNN, WSJ, Reuters, Bloomberg, etc.
To form frequent sets of keywords for the analysis, you should compose a list of some specific frequent terms, and using this list, you can find the terms which are associated with these frequent terms. E.g. a term "apple" is associated with "aapl", "ipad", "iphone". Then the following frequent sets can be investigated: "apple", "apple aapl", "apple aapl ipad", etc.
To work with this program, you need to install R (more info at http://r-project.org). You can start the program twm.r via file menu of R GUI, or simply drag and drop twm.r to R Console of R GUI.
Before starting the program twm.r, you need to install some additional packages, you can do this by running the installation.r program. All messages, including frequent terms and the lists of associations, appear on R Console.
Before starting the program twm.r, you need to install some additional packages, you can do this by running the installation.r program. All messages, including frequent terms and the lists of associations, appear on R Console.
Before the analysis, one should click on the buttons "Load new users' tweets" and "Load financial time series". Keep in mind that Twitter API does not allow to load a large number of tweets. So, if an error message from Twitter API appears, you need to wait several hours and then click again on the buttons "Load new users' tweets", the loading of new tweets will continue. Each time the latest tweets only will be loaded, previous tweets are saved in the file and can be used for the next analysis. So, when you load new tweets periodically, every day, then you will have no problems with exceeding the numbers of requests to Twitter API. To avoid such problems, you can decrease the value of max number of tweets which can be loaded for each user. This option can be set up in the file inc/config.r.
The analysis can also be performed without loading new tweets and financial time series. In this case the analysis will be carried out for previously loaded tweets and financial time series which are saved in the data files. For plotting a chart with candles and volumes, you should have Internet connection. To start new tweets database for the analysis, simply delete data files in the dir 'loaded_feeds'.
When you try to find frequent terms or associations for the first time per session or after loading new tweets, the program requires several minutes for documents-terms matrix creation. It happens only once per session.
To plot time dynamics of frequent sets of keywords, you need to specify a frequent set in the lower case, e.g. "apple", "apple aapl", "apple iphone", etc.; then choose a Stock symbol for comparing time series and choose the time windows for two moving averages, then click on the button "Plot Dynamics of Frequent Sets". The time dynamics of frequent sets of keywords includs two moving averages which can be used for trading strategy with the intersection of two moving averages.
Our next step is going to be the use of multivariate forecasting algorithms, based on the vector ARMA model. These algorithms can include many time series into analyses, the time series describe both stock prices and quantitative characteristics of tweets. I think such an approach will give the narrower and more precise forecasting. We are also planning to use the theory of semantic fields, frequent sets, association rules, Galois lattice, and the formal concepts analysis. Such an approach can be found in our previous investigations at
http://arxiv.org/ftp/arxiv/papers/1302/1302.2131.pdf
http://bpavlyshenko.blogspot.com/2012/12/the-model-of-semantic-concepts-lattice.html
Some printscreens:
GUI of Tweets Miner:

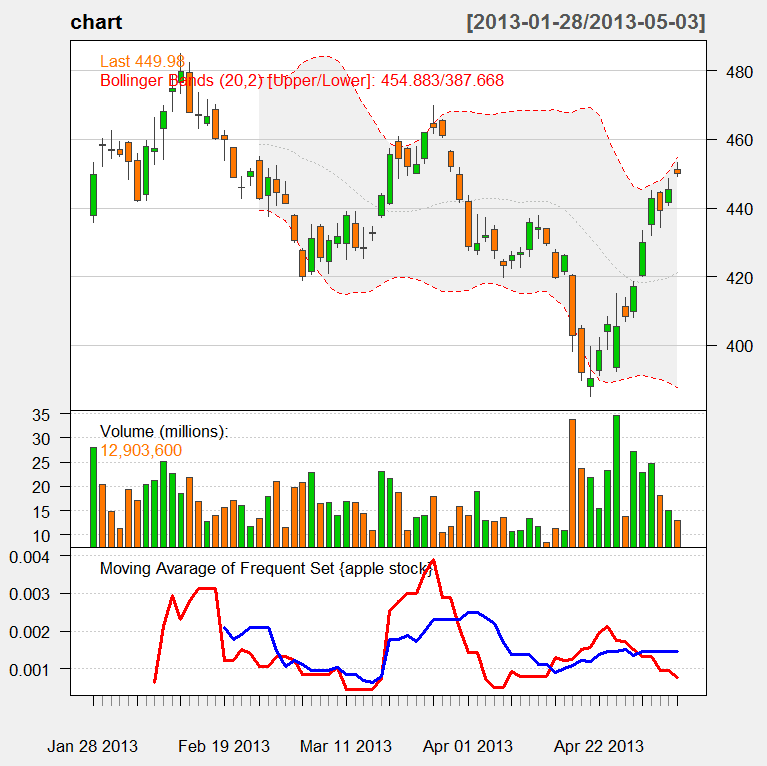
The time dynamics of the frequent set "apple stock" for trading strategy with the intersection of two moving averages:

Frequent Terms:


Crosscorrelation the frequent set "apple stock" with stock AAPL

ARIMA forecasting:

Best regards,
Bohdan Pavlyshenko
Hi,
ОтветитьУдалитьI just downloaded your tweet miner, but I get an error saying that:"Error in twInterfaceObj$doAPICall(cmd, params, method, ...) :
OAuth authentication is required with Twitter's API v1.1
"
Do you have an idea? btw, your analysis is very interesting
You need to register with twitter.com via browser, then try to start it again
УдалитьSolved it with example code from http://www.inside-r.org/packages/cran/twitteR/docs/exampleOauth
ОтветитьУдалитьReally i am impressed from this post....the person who created this post is a genius and knows how to keep the readers connected..Thanks for sharing this with us. I found it informative and interesting. Looking forward for more updates..
ОтветитьУдалитьStock Tips
Great. Nicely done. While I started testing (without OAuth) only with the existing data set, I got the following error messages. Any idea? Is there a way to let the Tcl/Tk code load the existing data explicitly?
ОтветитьУдалитьP.S. I used Ubuntu 13.04 latest R Studio and installed all the packages as per the notes. In fact, RCurl needed some extra steps to get the curl-config dev lib installed.
> source("inc/functions_tcltk.r")
[1] "Creating documents-terms matrix for new data"
Error in .Source(readPlain, encoding, length(x), FALSE, names(x), 0, TRUE, :
vectorized sources must have positive length
thanks
Renga